


Often times when dealing with a power logger or power analyzer you will see a waveform trend and maybe not be the most informed on what exactly it means. Below are the most common waveform patterns and a quick run down of what they mean as well as common causes and results of the waveform. JM Test is an authorized distributor of Fluke power analyzers and loggers. If you would like to rent or purchase an item to ensure that you are receiving the cleanest power and minimizing future downtime please give us a call at 1-800-353-3411
-
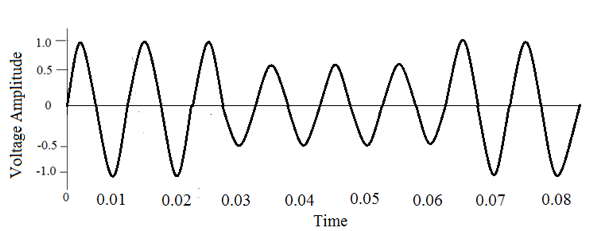
- Voltage Sag
- Definition
- short duration reduction in RMS voltage which can be caused by a short circuit, overload or starting of electric motors.
- Causes
- Large motor startups
- Line to ground fault
- Results
- Malfunction of IT equipment (PLC, PCs, ASDs)
- Malfunction of IT equipment (PLC, PCs, ASDs)
- Definition
- Voltage Sag
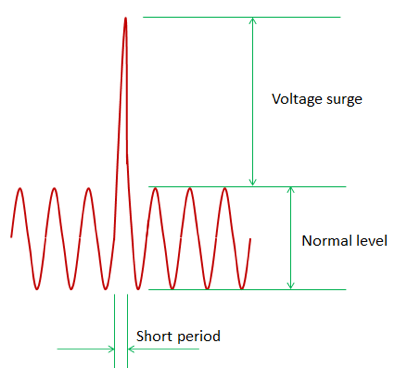
- Voltage Spikes
- Definition
- Fast, short duration electrical transients in voltage, current or transferred energy
- Causes
- Lightning strikes, power outages, short circuits, tripped circuit breakers, power transitions in other equipment on the same power line, electromagnetic pulses
- Results
- Destruction of electrical components and insulation as well as data process errors or data loss
- Destruction of electrical components and insulation as well as data process errors or data loss
- Definition
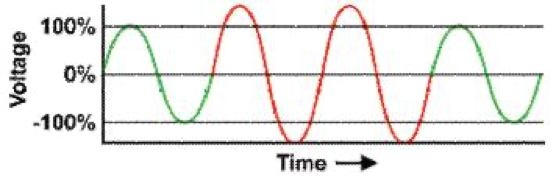
- Voltage Swell
- Definition
- Voltage swell is the exact opposite of voltage sag, which is a momentary increase in voltage
- Causes
- This is typically caused when a heavy load in a power system is turned off
- Results
- Data loss, flickering of lights or screens
- Data loss, flickering of lights or screens
- Definition
- Harmonic Distortion
- Definition
- Voltage or current waveforms that are non-sinusoidal in shape (not uniform in any way)
- Causes
- Furnaces, welding machines, DC brush motors, rectifiers
- Results
- Neutral overload in a 3-phase system, overheating of cables and equipment, electromagnetic interference with communication systems and loss of efficiency in electric machines

- Neutral overload in a 3-phase system, overheating of cables and equipment, electromagnetic interference with communication systems and loss of efficiency in electric machines
- Definition
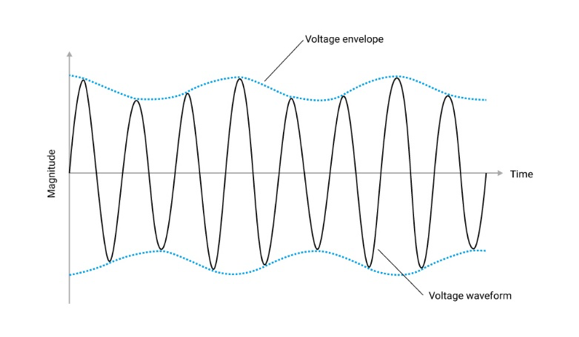
- Voltage Fluctuation
- Definition
- a regular change in voltage that happen when devices or equipment requiring a higher load are used.
- Causes
- Frequent start/stop of electric motors, oscillating loads, arc furnaces, arc welders, long power lines in a rural area
- Results
- Flickering screens, flickering light bulbs, early expiration of lighting
- Flickering screens, flickering light bulbs, early expiration of lighting
- Definition
- Noise
- Definition
- The result of more or less random electrical signals being picked up in circuits where they are unwelcome
- Causes
- Electrical interference from nearby equipment, also may be caused by improper grounding
- Results
- Disturbances on sensitive electronic equipment, this is typically is not destructive.

- Disturbances on sensitive electronic equipment, this is typically is not destructive.
- Definition
- Voltage unbalance
- Definition
- In a balanced three phase system, each phase voltage is equal or very close to being equal. Unbalance is a measurement of the inequality of the phase voltages. Voltage imbalance is the measure of voltage differences between the phases in a 3-phase system.
- Causes
- Mechanical stresses in motors due to lower than normal torque output or higher than normal current in motors and three phase rectifiers. Unbalance current will flow in neutral conductors in three phase wye systems.
- Results
- Unbalanced systems imply an existence of negative sequence which can be harmful to all three phase loads. The most affected are three phase induction machines
- The result of more or less random electrical signals being picked up in circuits where they are unwelcome

- Definition
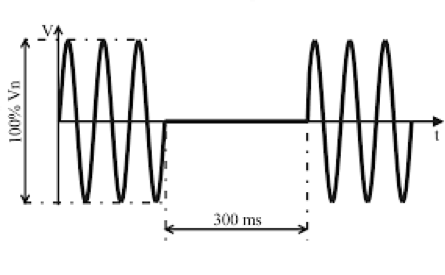
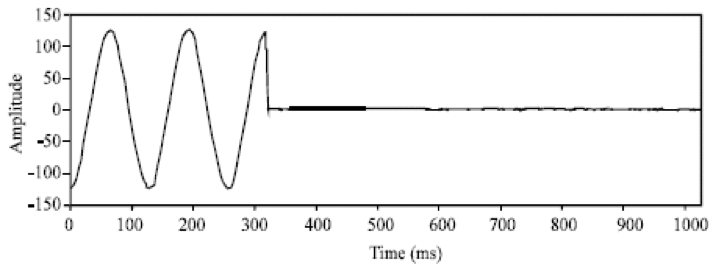
- Very short interruptions
- Definition
- A total interruption of electrical supply that can last from a few milliseconds to one or two seconds
- Causes
- Insulation failure or lightning or opening and automatic reclosure of protection devices
- Consequences
- Tripping of protection devices, malfunction of data processing equipment, and stoppage of sensitive equipment (such as PCs, PLCs, ASDs)
- Tripping of protection devices, malfunction of data processing equipment, and stoppage of sensitive equipment (such as PCs, PLCs, ASDs)
- Definition
- Long interruptions
- Definition
- Total interruption of electrical supply that will last for a duration longer than 1-2 seconds
- Causes
- Storms or objects knocking lines out of operation, fires, human errors and equipment failures
- Results
- All equipment will stop functioning
- All equipment will stop functioning
- Definition
Detecting Power Quality Issues
Understanding the most common power quality disturbances is only half the equation-being able to detect, capture, and verify those issues is essential for preventing downtime and protecting equipment. Modern power loggers and power quality analyzers from brands like Fluke, Dranetz, and Hioki make this process faster and more accurate. Below is an overview of the key techniques and indicators technicians use when diagnosing power quality problems.
Using Power Loggers and Analyzers
A power quality analyzer measures voltage, current, frequency, and harmonic content over time. When connected to a facility’s electrical system, it captures real-time data and timestamps disturbances so you can correlate symptoms with events (motor starts, load switching, utility disturbances, etc.). Many analyzers also provide automated EN50160 or IEEE 519 compliance reports for verifying system health.
Identifying Issues Through Waveforms
Waveform distortion is one of the most direct ways to detect abnormal conditions.
- Flat-topped waveforms often indicate harmonic distortion.
- Notches or spikes point to switching events or transient activity.
- Drooping or elevated amplitude aligns with voltage sags and swells.
Reviewing these patterns over minutes, hours, or days helps confirm whether issues are random, cyclical, or load-related.
Monitoring Event Logs
Most power quality tools automatically log:
- Sags
- Swells
- Interruptions
- Transients
- Frequency deviations
- Total Harmonic Distortion (THD)
These logs allow technicians to analyze the magnitude, duration, and frequency of faults-critical data for determining whether the root cause is internal (equipment, motors, wiring) or external (utility-side disturbances).
Checking Harmonics and THD Levels
High harmonic content leads to overheating, nuisance tripping, and premature failure of sensitive electronics. Power quality meters measure individual harmonic orders (3rd, 5th, 7th, etc.) and THD%, making it easy to identify non-linear loads affecting the system. Consistently elevated THD may indicate rectifiers, VFDs, welders, or other equipment generating harmonic currents.
Verifying Voltage Balance in Three-Phase Systems
A quick diagnostic for three-phase equipment is checking phase-to-phase voltage balance. Even a few percentage points of imbalance can create excessive heating in motors and transformers. Power analyzers display phase imbalance in real time, enabling faster corrective action.
Trending Long-Term Data
Some issues only appear under specific load conditions or at certain times of day. Long-term trending helps identify patterns such as:
- Voltage dips during shift changes
- Lighting-induced fluctuations
- Seasonal variations caused by HVAC demand
- Utility-side disturbances during high load periods
This type of monitoring is essential for troubleshooting intermittent faults that do not appear during a basic snapshot measurement.
When to Use a Professional Analyzer
While handheld tools can identify simple faults, more complex issues-like high-order harmonics, intermittent transients, or voltage unbalance-often require advanced, permanently installed power analyzers or a rental power logger for multi-day or multi-week studies. JM Test offers both rental and purchase options to help facilities validate power quality before equipment damage or downtime occurs.
-

AEMC PEL 103 Power & Energy Logger (with display)- DISCONTINUED
SKU: PEL103This product has multiple variants. The options may be chosen on the product page -

AEMC PEL 105 Power and Energy Logger
SKU: PEL 105 -

Fluke 1735 Power Logger – Obsolete
SKU: 1735 -

Fluke 1736 Power Logger
SKU: 1736 -

Fluke 1738 Advanced Power Logger
SKU: 1738 -

Fluke 435 Series II Power Quality Analyzer
SKU: 435 series II -

Fluke 438-II Power Quality and Motor Analyzer – Obsolete
SKU: 438-II -

Megger MPQ1000 Handheld Power Quality Analyzer – discontinued
SKU: MPQ1000
